Reddit Example Dataset
A walkthrough of the dataset code for the Big Graph Dataset project
Alex Davies, University of Bristol, 2024
In this notebook we’ll write code to:
download a large Reddit graph from an online repository
sample that graph to produce a dataset of smaller graphs
process that dataset into a Pytorch Geometric InMemoryDataset
Getting the graph
First we need to download the graph, here from the Stanford Network Analysis Project
We first find the links for the graph and node features (here node features are text embeddings):
[1]:
graph_url = "https://snap.stanford.edu/data/soc-redditHyperlinks-title.tsv"
embedding_url = "http://snap.stanford.edu/data/web-redditEmbeddings-subreddits.csv"
Then play with directories and download the data:
[2]:
import os
import pickle
import wget
import pandas as pd

# Swap into dataset directory
print(os.getcwd())
start_dir = os.getcwd()
os.chdir("bgd_files")

# We won't actually need this part in the final function!
if "reddit" not in os.listdir():
    os.mkdir("reddit")

os.chdir("reddit")

#  Download raw files if we don't already have them
if "soc-redditHyperlinks-title.tsv" not in os.listdir():
    graph_data = wget.download(graph_url) # Edgelist and edge features
if "web-redditEmbeddings-subreddits.csv" not in os.listdir():
    embedding_data = wget.download(embedding_url) # Node features

# We know that there are 300 components in the node feature vectors
embedding_column_names = ["COMPONENT", *[i for i in range(300)]]
embeddings = pd.read_csv("web-redditEmbeddings-subreddits.csv", names=embedding_column_names).transpose()
graph_data = pd.read_csv("soc-redditHyperlinks-title.tsv", sep = "\t")


# Avoids weird directory problems
os.chdir(start_dir)
/home/alex/Projects/big-graph-dataset
Let’s have a look at the node embeddings:
[3]:
embeddings.head()
[3]:
| 0 | 1 | 2 | 3 | 4 | 5 | 6 | 7 | 8 | 9 | ... | 51268 | 51269 | 51270 | 51271 | 51272 | 51273 | 51274 | 51275 | 51276 | 51277 | |
|---|---|---|---|---|---|---|---|---|---|---|---|---|---|---|---|---|---|---|---|---|---|
| COMPONENT | spiders | askreddit | globaloffensivetrade | fireteams | funny | the_donald | videos | news | leagueoflegends | rocketleagueexchange | ... | motleyfool | govtjobsrchinindia | snoopdogg | fortean | whatcanidoforbernie | 33rd | bestofvic2015 | aberystwyth | mail_forwarding | cover |
| 0 | 0.158972 | -0.499114 | -0.023145 | 2.492506 | -0.81937 | -0.123265 | 0.131896 | 0.132825 | -2.785298 | 0.553341 | ... | 0.004494 | 0.001908 | -0.000534 | 0.000615 | 0.000906 | -0.000076 | -0.000203 | -0.001563 | 0.009269 | 0.00457 |
| 1 | 0.285813 | 0.323983 | -1.199374 | -2.529917 | -0.865261 | -0.610208 | 0.866419 | 1.505527 | -0.166391 | -3.283354 | ... | 0.052268 | 0.042618 | 0.023619 | 0.023847 | 0.017816 | -0.001643 | 0.012698 | 0.004733 | 0.024779 | 0.012403 |
| 2 | 0.226329 | -0.424809 | 1.661484 | -0.448484 | 0.301753 | 0.361495 | 0.919025 | 0.730393 | 1.592624 | -3.091485 | ... | -0.027792 | -0.021329 | -0.003317 | -0.018297 | -0.004231 | -0.002896 | -0.007575 | -0.000082 | -0.017018 | -0.000363 |
| 3 | -0.183338 | -0.222705 | -1.025296 | -3.543441 | 0.018787 | -1.171773 | -0.765584 | -0.505759 | -1.269829 | 0.877085 | ... | 0.013468 | 0.012 | 0.005566 | -0.004873 | -0.010438 | 0.000581 | 0.006486 | -0.000982 | -0.007228 | -0.002496 |
5 rows × 51278 columns
And now the edges:
[4]:
graph_data.head()
[4]:
| SOURCE_SUBREDDIT | TARGET_SUBREDDIT | POST_ID | TIMESTAMP | LINK_SENTIMENT | PROPERTIES | |
|---|---|---|---|---|---|---|
| 0 | rddtgaming | rddtrust | 1u4pzzs | 2013-12-31 16:39:18 | 1 | 25.0,23.0,0.76,0.0,0.44,0.12,0.12,4.0,4.0,0.0,... |
| 1 | xboxone | battlefield_4 | 1u4tmfs | 2013-12-31 17:59:11 | 1 | 100.0,88.0,0.78,0.02,0.08,0.13,0.07,16.0,16.0,... |
| 2 | ps4 | battlefield_4 | 1u4tmos | 2013-12-31 17:59:40 | 1 | 100.0,88.0,0.78,0.02,0.08,0.13,0.07,16.0,16.0,... |
| 3 | fitnesscirclejerk | leangains | 1u50xfs | 2013-12-31 19:01:56 | 1 | 49.0,43.0,0.775510204082,0.0,0.265306122449,0.... |
| 4 | fitnesscirclejerk | lifeprotips | 1u51nps | 2013-12-31 21:02:28 | 1 | 14.0,14.0,0.785714285714,0.0,0.428571428571,0.... |
Turn the data into a graph
Now we need to turn the data into a graph. Our edges come from graph_data (SOURCE and TARGET), including categories for each edge (LINK_SENTIMENT), as well as edge features (PROPERTIES).
The first step is making a networkx.Graph object, which is a useful graph class, then we add the nodes one by one. We’ll include the text embedding for the subreddit as a node attribute, taken from the embedding dataframe.
[5]:
# networkx is a Python library for graph structures
import networkx as nx
# tqdm for loading bars
from tqdm import tqdm
# cheeky function to visualise a networkx graph
from bgd.utils import vis_networkx

embeddings.columns = embeddings.iloc[0]
embeddings = embeddings.drop(["COMPONENT"], axis = 0)

graph = nx.Graph()

# Add a node for each id in the embedding data
for col in tqdm(embeddings.columns, desc = "Adding nodes"):
    # attrs here is taken from the embedding data, with the node id the column (col)
    graph.add_node(col, attrs=embeddings[col].to_numpy().astype(float))
Adding nodes: 100%|██████████| 51278/51278 [00:01<00:00, 32961.66it/s]
Now we add the edges (the actual graph stuff).
We need to include two properties:
Type of edge, negative or positive interaction, -1 or 1. In dataframe as LINK_SENTIMENT
Properties of the edge, text embedding of the reddit post content
[6]:
import numpy as np

def fix_property_string(input_string):
    input_string = input_string.split(',')
    input_string = [float(item) for item in input_string]

    return np.array(input_string)

sources = graph_data["SOURCE_SUBREDDIT"].to_numpy()
targets = graph_data["TARGET_SUBREDDIT"].to_numpy()

# This line can take a while!
attrs = [fix_property_string(properties) for properties in tqdm(graph_data["PROPERTIES"].tolist(), desc = "Wrangling edge features")]
Wrangling edge features: 100%|██████████| 571927/571927 [00:05<00:00, 103705.47it/s]
Now iterate over the edges, only adding them if their nodes have data:
[7]:
labels = graph_data["LINK_SENTIMENT"].to_numpy()
all_nodes = list(graph.nodes())

for i in tqdm(range(sources.shape[0]), desc = "Adding edges"):
    # Check that the edge has data
    if sources[i] in all_nodes and targets[i] in all_nodes:
        graph.add_edge(sources[i], targets[i],
                    labels = labels[i],
                    attr = attrs[i])
Adding edges: 100%|██████████| 571927/571927 [00:37<00:00, 15434.45it/s]
[8]:
print(graph)

# Last tidying bits
graph = nx.convert_node_labels_to_integers(graph)
CGs = [graph.subgraph(c) for c in nx.connected_components(graph)]
CGs = sorted(CGs, key=lambda x: x.number_of_nodes(), reverse=True)
graph = CGs[0]
graph = nx.convert_node_labels_to_integers(graph)

# Save the graph!
with open("bgd_files/reddit/reddit-graph.npz", "wb") as f:
    pickle.dump(graph, f)
Graph with 51278 nodes and 178143 edges
Nice! Graph achieved. Spot that in the last section we had to deal with some missing data - we’re including edges ONLY if their nodes also have data.
Sample to make a dataset of smaller graphs
This is not too hard, I’ve written some code (Exploration Sampling With Replacement, ESWR) that does the sampling for you.
This will produce a big list of small networkx graphs sampled from that original graph.
[9]:
from bgd.utils import ESWR

# Sample 1000 graphs of max 96 nodes from the big reddit graph
nx_graph_list = ESWR(graph, 1000, 96)
Sampling 1000 in 5 chunks with size 200
Sampling from large graph: 100%|██████████| 6/6 [00:07<00:00, 1.31s/it]
Done sampling!
Next we need to convert it to a Pytorch Geometric format. This will be specific to your data - here we have node labels, edge labels, edge attributes.
[10]:
import torch
from torch_geometric.data import Data

def specific_from_networkx(graph):
    # Turns a graph into a pytorch geometric object
    # Mostly by unpacking dictionaries on nodes and edges
    # Here node labels are the target
    # One of these functions for each dataset ideally - they are unlikely to transfer across datasets
    node_attrs = []
    edge_indices = []
    edge_labels = []
    edge_attrs = []

    # Collect node labels and attributes
    for n in list(graph.nodes(data=True)):
        # list(graph.nodes(data=True)) returns [(node_id1, {attribute dictionary}), (node_id2, ...), (node_id3, ...)]
        node_attrs.append(torch.Tensor(n[1]["attrs"]))

    # Collect edge indices and attributes
    for e in graph.edges(data=True):
        # graph.edges(data=True) is a generator producing (node_id1, node_id2, {attribute dictionary})
        edge_indices.append((e[0], e[1]))

        edge_attrs.append(torch.Tensor(e[2]["attr"]))
        edge_labels.append(e[2]["labels"])


    # Specific to classification on edges! This is a binary edge classification (pos/neg) task
    edge_labels = ((torch.Tensor(edge_labels) + 1)/2).reshape(-1,1)

    edge_attrs = torch.stack(edge_attrs)
    node_attrs = torch.stack(node_attrs)
    edge_indices = torch.tensor(edge_indices, dtype=torch.long).t().contiguous()

    # Create PyG Data object
    # Can pass:
    # x:            node features, shape (n nodes x n features)
    # edge_index:   the list of edges in the graph, shape (2, n_edges). Entries edge_index[i, :] are [node_id1, node_id2].
    # edge_attr:    edge features, shape (n_edges, n_features), same order as edgelist
    # y:            targets. Graph regression shape (n_variables), graph classification (n_classes), node classification (n_nodes, n_classes), edge classification (n_edges, n_classes)
    data = Data(x=node_attrs, edge_index=edge_indices, edge_attr = edge_attrs,  y=edge_labels)

    return data

print("Data in torch geometric format:")
specific_from_networkx(nx_graph_list[0])
Data in torch geometric format:
/home/alex/anaconda3/envs/adgcl/lib/python3.8/site-packages/tqdm/auto.py:21: TqdmWarning: IProgress not found. Please update jupyter and ipywidgets. See https://ipywidgets.readthedocs.io/en/stable/user_install.html
  from .autonotebook import tqdm as notebook_tqdm
[10]:
Data(x=[54, 300], edge_index=[2, 249], edge_attr=[249, 86], y=[249, 1])
The final dataset
Finally we place all that data into an InMemoryDataset!
Please note that in-code this whole notebook will be in functions - see datasets/example_dataset.py.
This means that the datalist argument wouldn’t actually exist below - instead you’d call something like get_reddit_dataset() within your .process method.
[13]:
from torch_geometric.data import InMemoryDataset
from bgd.utils import vis_grid
class RedditDataset(InMemoryDataset):
r"""
Reddit hyperlink graphs - ie graphs of subreddits interacting with one another.
The original graph is sourced from:
`Kumar, Srijan, et al. "Community interaction and conflict on the web." Proceedings of the 2018 world wide web conference. 2018.`
The data has text embeddings as node features for each subreddit and text features for the cross-post edges.
The task is edge classification for the sentiment of the interaction between subreddits.
- Task: Edge classification
- Num node features: 300
- Num edge features: 86
- Num target values: 1
- Target shape: N Edges
- Num graphs: Parameterised by `num`
Args:
root (str): Root directory where the dataset should be saved.
datalist (list): A list of pytorch geometric data objects. Only obtained from an argument here, not in actual code!
stage (str): The stage of the dataset to load. One of "train", "val", "test". (default: :obj:`"train"`)
transform (callable, optional): A function/transform that takes in an :obj:`torch_geometric.data.Data` object and returns a transformed version. The data object will be transformed before every access. (default: :obj:`None`)
pre_transform (callable, optional): A function/transform that takes in an :obj:`torch_geometric.data.Data` object and returns a transformed version. The data object will be transformed before being saved to disk. (default: :obj:`None`)
pre_filter (callable, optional): A function that takes in an :obj:`torch_geometric.data.Data` object and returns a boolean value, indicating whether the data object should be included in the final dataset. (default: :obj:`None`)
num (int): The number of samples to take from the original dataset. (default: :obj:`2000`).
"""
# datalist is only an argument for this notebook example - see existing datasets under bgd/.. for how it actually works
def __init__(self, root, datalist, stage = "train", transform=None, pre_transform=None, pre_filter=None, num = 2000):
self.num = num
self.stage = stage
self.stage_to_index = {"train":0,
"val":1,
"test":2}
self.datalist = datalist
# Options are node-classification, node-regression, graph-classification, graph-regression, edge-regression, edge-classification
# Graph-level tasks are preferred! (graph-classification and graph-regression)
# edge-prediction is another option if you can't think of a good task
self.task = "node-classification"
super().__init__(root, transform, pre_transform, pre_filter)
self.data, self.slices = torch.load(self.processed_paths[self.stage_to_index[self.stage]])
@property
def raw_file_names(self):
# Replace with your saved raw file name
return ['reddit-graph.npz']
@property
def processed_file_names(self):
return ['train.pt',
'val.pt',
'test.pt']
def process(self):
# Read data into huge `Data` list.
if os.path.isfile(self.processed_paths[self.stage_to_index[self.stage]]):
print(f"Cora files exist")
return
# Get a list of num pytorch_geometric.data.Data objects
data_list = self.datalist # get_example_dataset(num=self.num)
# Torch geometric stuff
if self.pre_filter is not None:
data_list = [data for data in data_list if self.pre_filter(data)]
if self.pre_transform is not None:
data_list = [self.pre_transform(data) for data in data_list]
# Save data
data, slices = self.collate(data_list)
torch.save((data, slices), self.processed_paths[self.stage_to_index[self.stage]])
pyg_graphs = [specific_from_networkx(g) for g in tqdm(nx_graph_list, desc = "Converting data to PyG data objects")]
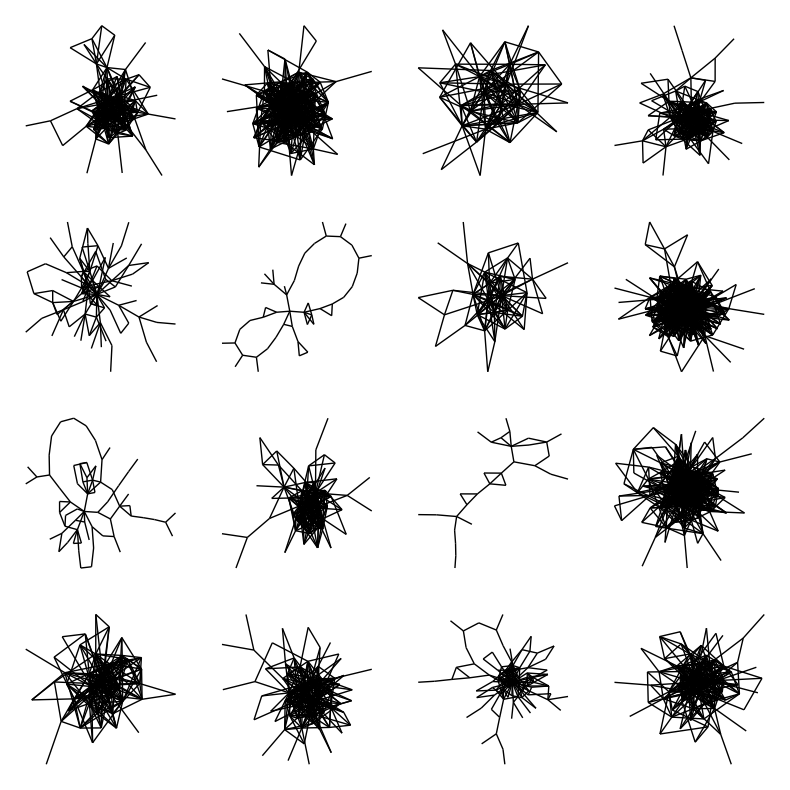
# The visualisation doesn't work in documentation :( uncomment to see the graphs
vis_grid(pyg_graphs[:16], os.getcwd() + "/bgd_files/reddit/example.png", show_plot = True)
train_dataset = RedditDataset(os.getcwd() + "/bgd_files/reddit",
pyg_graphs)
Converting data to PyG data objects: 100%|██████████| 1000/1000 [00:01<00:00, 991.15it/s]
/home/alex/Projects/big-graph-dataset/utils.py:398: UserWarning: The figure layout has changed to tight
  plt.tight_layout()
Cora files exist
Processing...
Done!
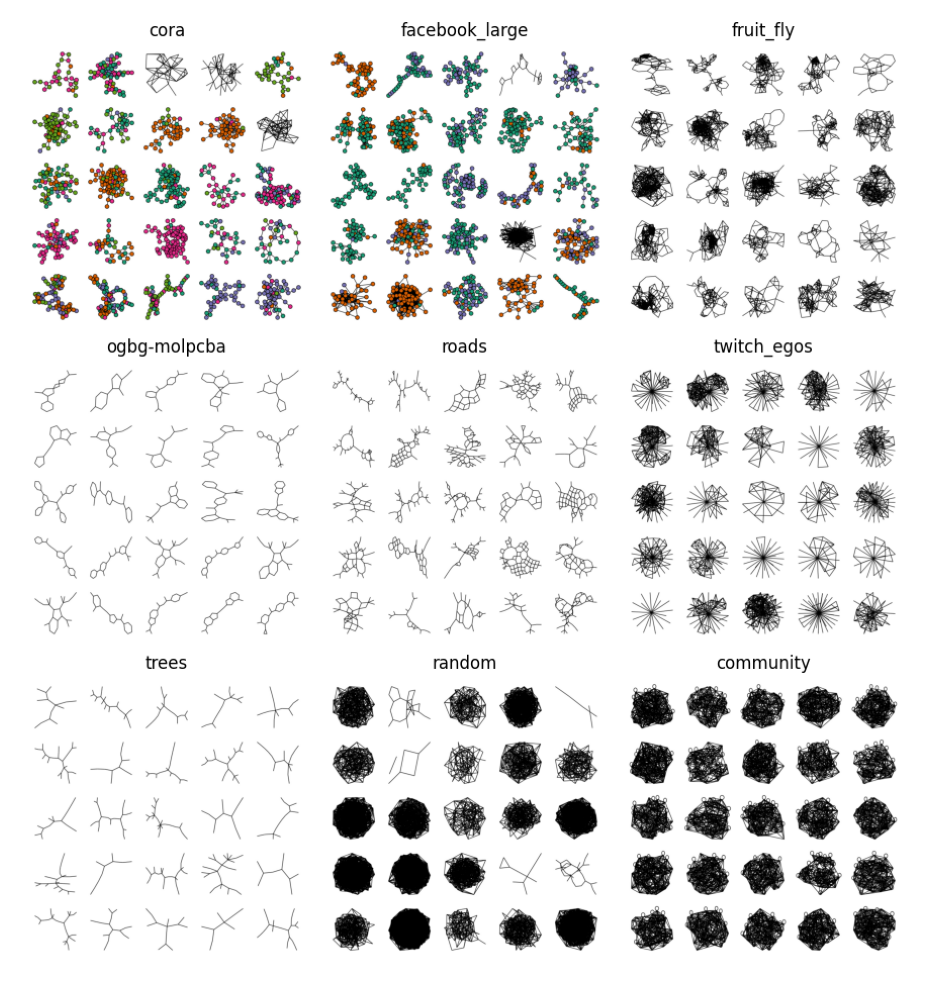
Other datsets
There are already some datasets we can look at under bgd/DATASET.py.
[18]:
import matplotlib.pyplot as plt

fig = plt.figure(figsize = (10,10))
im = plt.imread("docs/source/_static/datasets.png")
plt.imshow(im)
plt.axis('off')
plt.tight_layout()
plt.show()
[ ]: